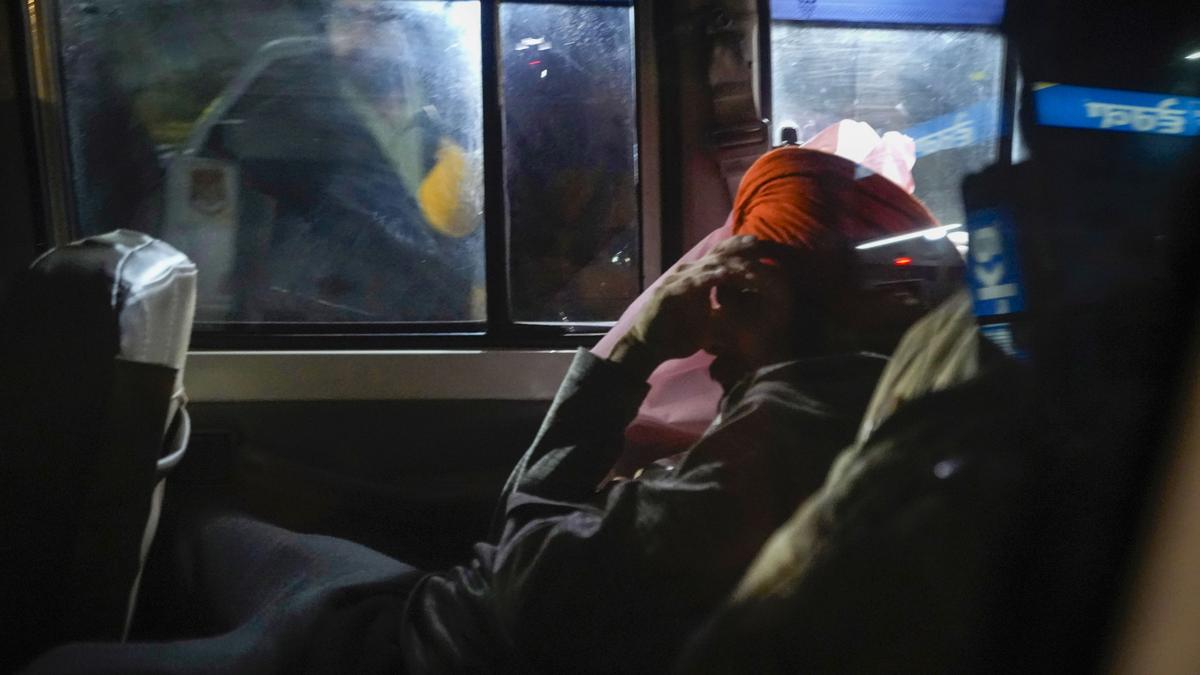
An Indian deported from the U.S. leave the airport upon their arrival in Amritsar
| Photo Credit: –
Of the 332 undocumented Indian immigrants who have been deported from the U.S. in 2025, people from Punjab accounted for the highest share (38%), followed by people from Haryana (33%), and Gujarat (22%), as shown in Chart 1. The remaining deportees were from Maharashtra, Uttar Pradesh, Himachal Pradesh, and other States and UTs.
Chart 1 | The chart shows the State-wise share of Indian citizens deported from the U.S. in 2025
A recent research paper published by Johns Hopkins University also found that between October 2001 and November 2022, 66% of those who sought asylum in the U.S. were Punjabi speakers. Nearly 14% were Hindi speakers, 8% were English speakers, and 7% were Gujarati speakers. The paper showed a sharp spike in asylum seekers in the U.S. from India after 2016, with Punjabi speakers making up the majority.
In fact, all the three flights carrying Indian deportees from the U.S. this year landed at the Amritsar International Airport, leading to a controversy. Punjab Chief Minister Bhagwant Mann alleged that the Centre is doing this intentionally to defame the State. The Centre argued that Amritsar is the closest international airport for flights entering India from the U.S.

While the latest wave of deportations has grabbed headlines since the deportees were handcuffed and chained during their journey, this is not a phenomenon that has emerged after U.S. President Donald Trump’s renewed crackdown on illegal immigrants. Since 2009, 15,897 undocumented Indian immigrants have been deported from the U.S. (Chart 2).
Chart 2 | The chart shows the number of undocumented Indian immigrants deported from the U.S. since 2009
Most deportations occurred in 2019 (2,042), followed by 2020 (1,889), and 2024 (1,368). It is also important to note that the number of Indians attempting to enter the U.S. illegally has surged in recent years. A decade ago, U.S. border authorities stopped not more than 1,500 Indian illegal migrants. This figure rose sharply to 96,917 in 2023 and 90,415 in 2024.
News reports have also highlighted how most Indian immigrants were deceived by fraudulent agents who promised them better prospects in exchange for hefty sums of money. The sum paid by Indians to illegally enter the U.S. ranged anywhere between ₹20 lakh and ₹1.25 crore.
A total of 3,042 illegal agents have been identified till June 2024 (Chart 3), with the highest number of agents in Andhra Pradesh, followed by Uttar Pradesh, Tamil Nadu, and Maharashtra. In the last four years, 4,361 complaints have been lodged against illegal agents for luring Indians with false recruitment offers.
Chart 3 | The chart shows the State-wise number of illegal agents identified till June 2024|
Interviews with the deportees have shed light on the perilous journeys they undertake in search of a better life. A popular way of getting to the U.S. is through what is known as the “donkey route”.

This refers to the arduous journey across countries, forests, and seas, often without proper food and water. A section of the immigrants end up at the south-western border of the U.S. after travelling across dangerous routes such as the Darien Gap between Panama and Colombia, while others go via the northern border of the U.S.
Chart 4 shows that Indians prefer both the Canadian (northern) and south-western (Mexican) borders to enter the U.S. illegally. A New York Times report shows that the sharp spike in illegal crossings from the Canadian border was majorly fuelled by Indians.
Chart 4 | The chart shows the number of Indian immigrants encountered at Southwest and Northern border to the U.S.
Apart from those attempting to enter the U.S. illegally, there are also many who have overstayed their visas after being admitted into the U.S. either for business, studies, or other purposes (Chart 5).
Chart 5 | The chart shows the number of Indians who have overstayed their visas after being admitted into the U.S. for various purposes
While such overstays have declined after the pandemic, close to 17,000 people overstay every year, with most of them having entered the U.S. for business or pleasure.
Source: The data for the charts were sourced from Lok Sabha replies and U.S. Customs and Border Protection
Published – February 19, 2025 07:00 am IST

